
Features
ReliaEn 1.0 is one product with one licence. Every feature on this page is in every licence, and the free trial opens all of it.

How the features connect
Every feature on this page sits on one line, and the data moves in one direction:
- Records. Your failure and repair history, from worksheets, imported files or CMMS work orders.
- Analysis. ReliaEn fits models to those records and reports reliability, availability and cost.
- Decision. ReliaEn turns each result into a maintenance interval, a spare-parts level or a maintenance strategy, and shows it next to your current value.
- Action. You approve a decision, and it becomes a PM plan, a stock level or a work order.
- New records. Each closed work order adds a failure record, and the next analysis starts from it.
Each section below starts with what it takes from the step before and ends with what it hands to the step after. The sections follow the order of the modules: reliability analyses and FMEA studies, the CMMS, asset criticality, Asset Health, the Bridge and AI Support.
Reliability
Takes: your failure and repair data. Gives: a report with tables and plots, which you can export as PDF, HTML or Word. The sections run in the order of the work: fit a model, build the system, find the risk, choose the action.
- Life data
Takes: exact failure times, censored data or grouped inspection data. Gives: the fitted life model that the later sections use.
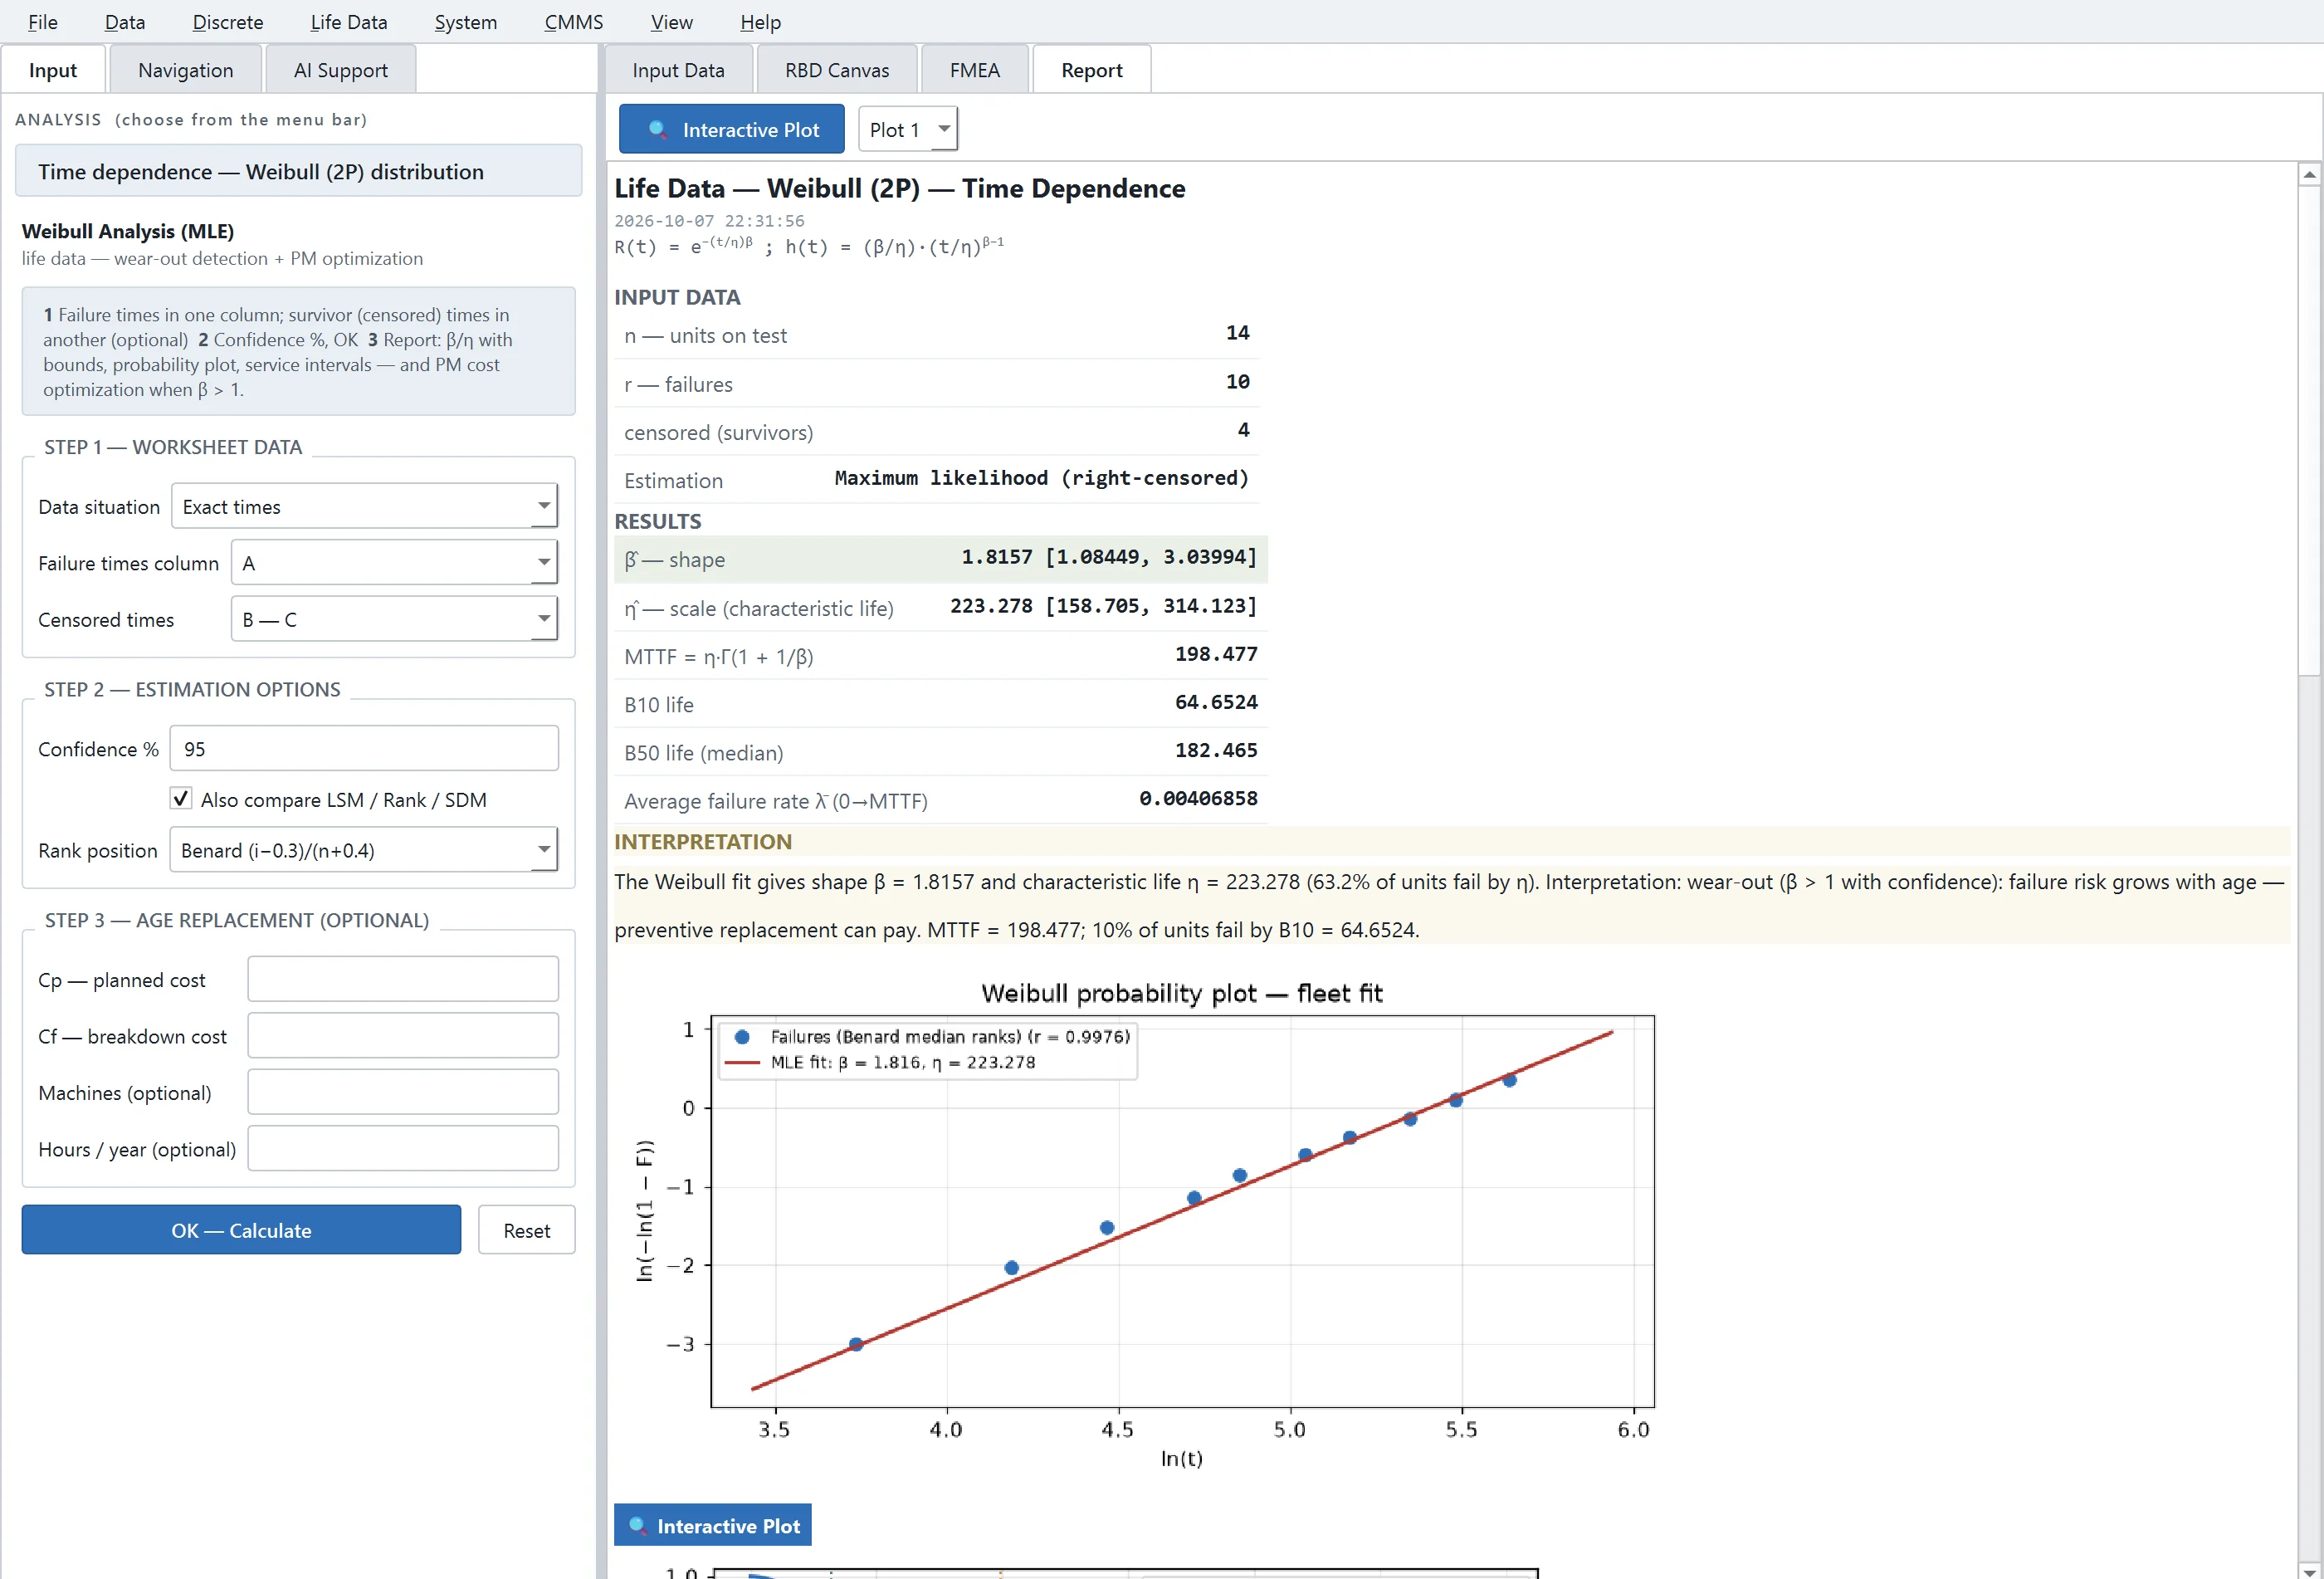
ReliaEn fits these distributions: Weibull (2-parameter and 3-parameter), exponential, lognormal, gamma, smallest extreme value, logistic and loglogistic. It uses maximum likelihood estimation, and every fit includes confidence bounds. The report shows probability plots, B-lives, the mean time to failure (MTTF) and service-interval tables.
- Discrete reliability
Takes: pass/fail data. Gives: a model check that confirms the data fit before you rely on the result.
ReliaEn analyses the data with binomial and Poisson models. The test can end after a fixed number of failures or after a fixed time. A χ² goodness-of-fit test shows whether the model fits your data.
- Accelerated life testing (ALT)
Takes: failure times from tests at higher stress, such as higher temperature or voltage. Gives: the life at normal use, which is the input for the life model of a unit.
ReliaEn fits Arrhenius, Eyring and inverse power law models to the times. The report gives the expected life of the unit at your normal use level.
- Degradation
Takes: repeated wear measurements of one unit. Gives: the remaining useful life (RUL), which tells you how soon to act.
ReliaEn fits a gamma process or a Wiener process to the measurements. It then estimates how long the unit will take to go from its last measurement to your failure threshold. This time is the RUL.
- Repairable systems and the generalised renewal process (GRP)
Takes: the event times of each unit in a fleet, or of one repairable unit. Gives: a fitted model of ageing and repair, which the RAM simulation uses.
ReliaEn plots the mean cumulative function (MCF) and fits a power-law process to the failure times.
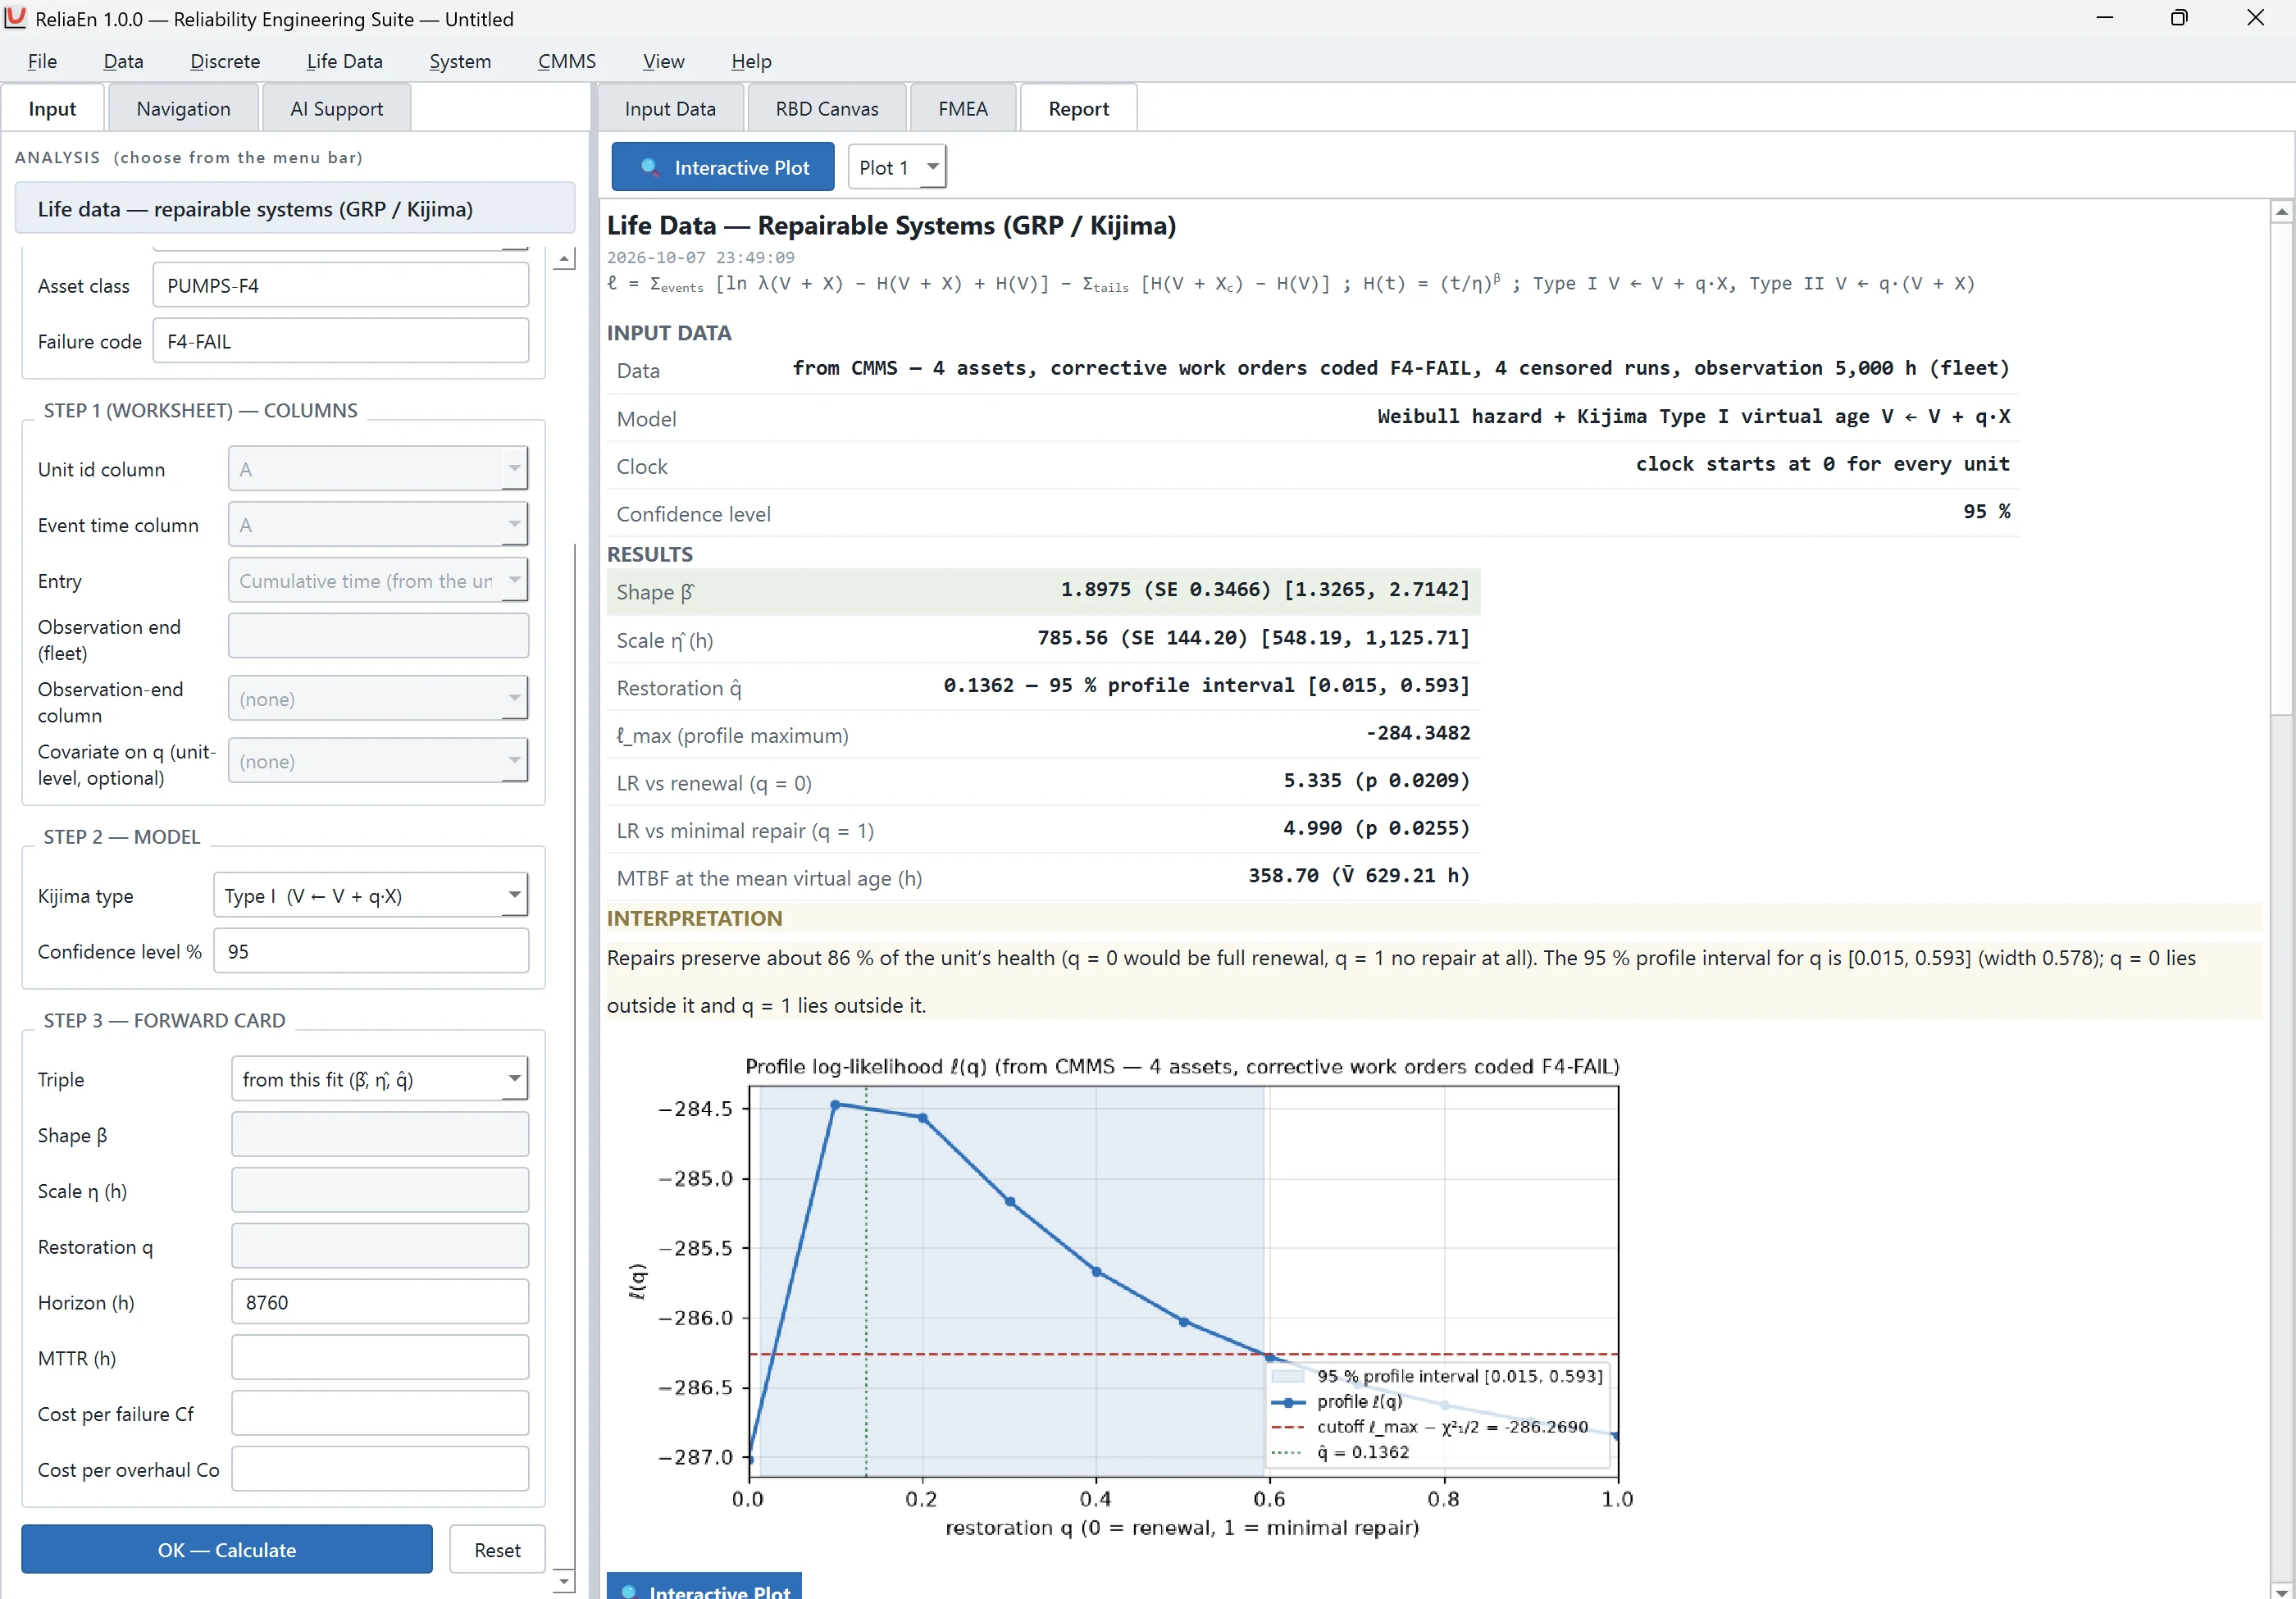
The GRP / Kijima analysis reads the failure event log of a fleet: the event times of each unit and the end of the observation period. The data can come from worksheet columns or directly from corrective work orders in the CMMS. The analysis estimates two things together: the ageing law (Weibull shape β and scale η) and the repair quality q. The value of q ranges from “as good as new” to “as bad as old”.
ReliaEn also gives a Bayesian estimate of q and can model covariates that affect q. You can then use the fitted model in the reliability, availability and maintainability (RAM) simulation.
- Survival, regression, warranty and test plans
Takes: life data with covariates, or your warranty and test requirements. Gives: plots, regression models and test plans.
ReliaEn draws survival plots and fits Cox regression, regression with life data, and probit models. It predicts warranty returns. It also calculates test plans for reliability demonstration tests and estimation tests. Each plan gives the number of units, the test time and the number of failures allowed.
- Reliability block diagrams (RBD)
Takes: the failure models from the sections above. Gives: system reliability, which the simulation and the optimisation use.
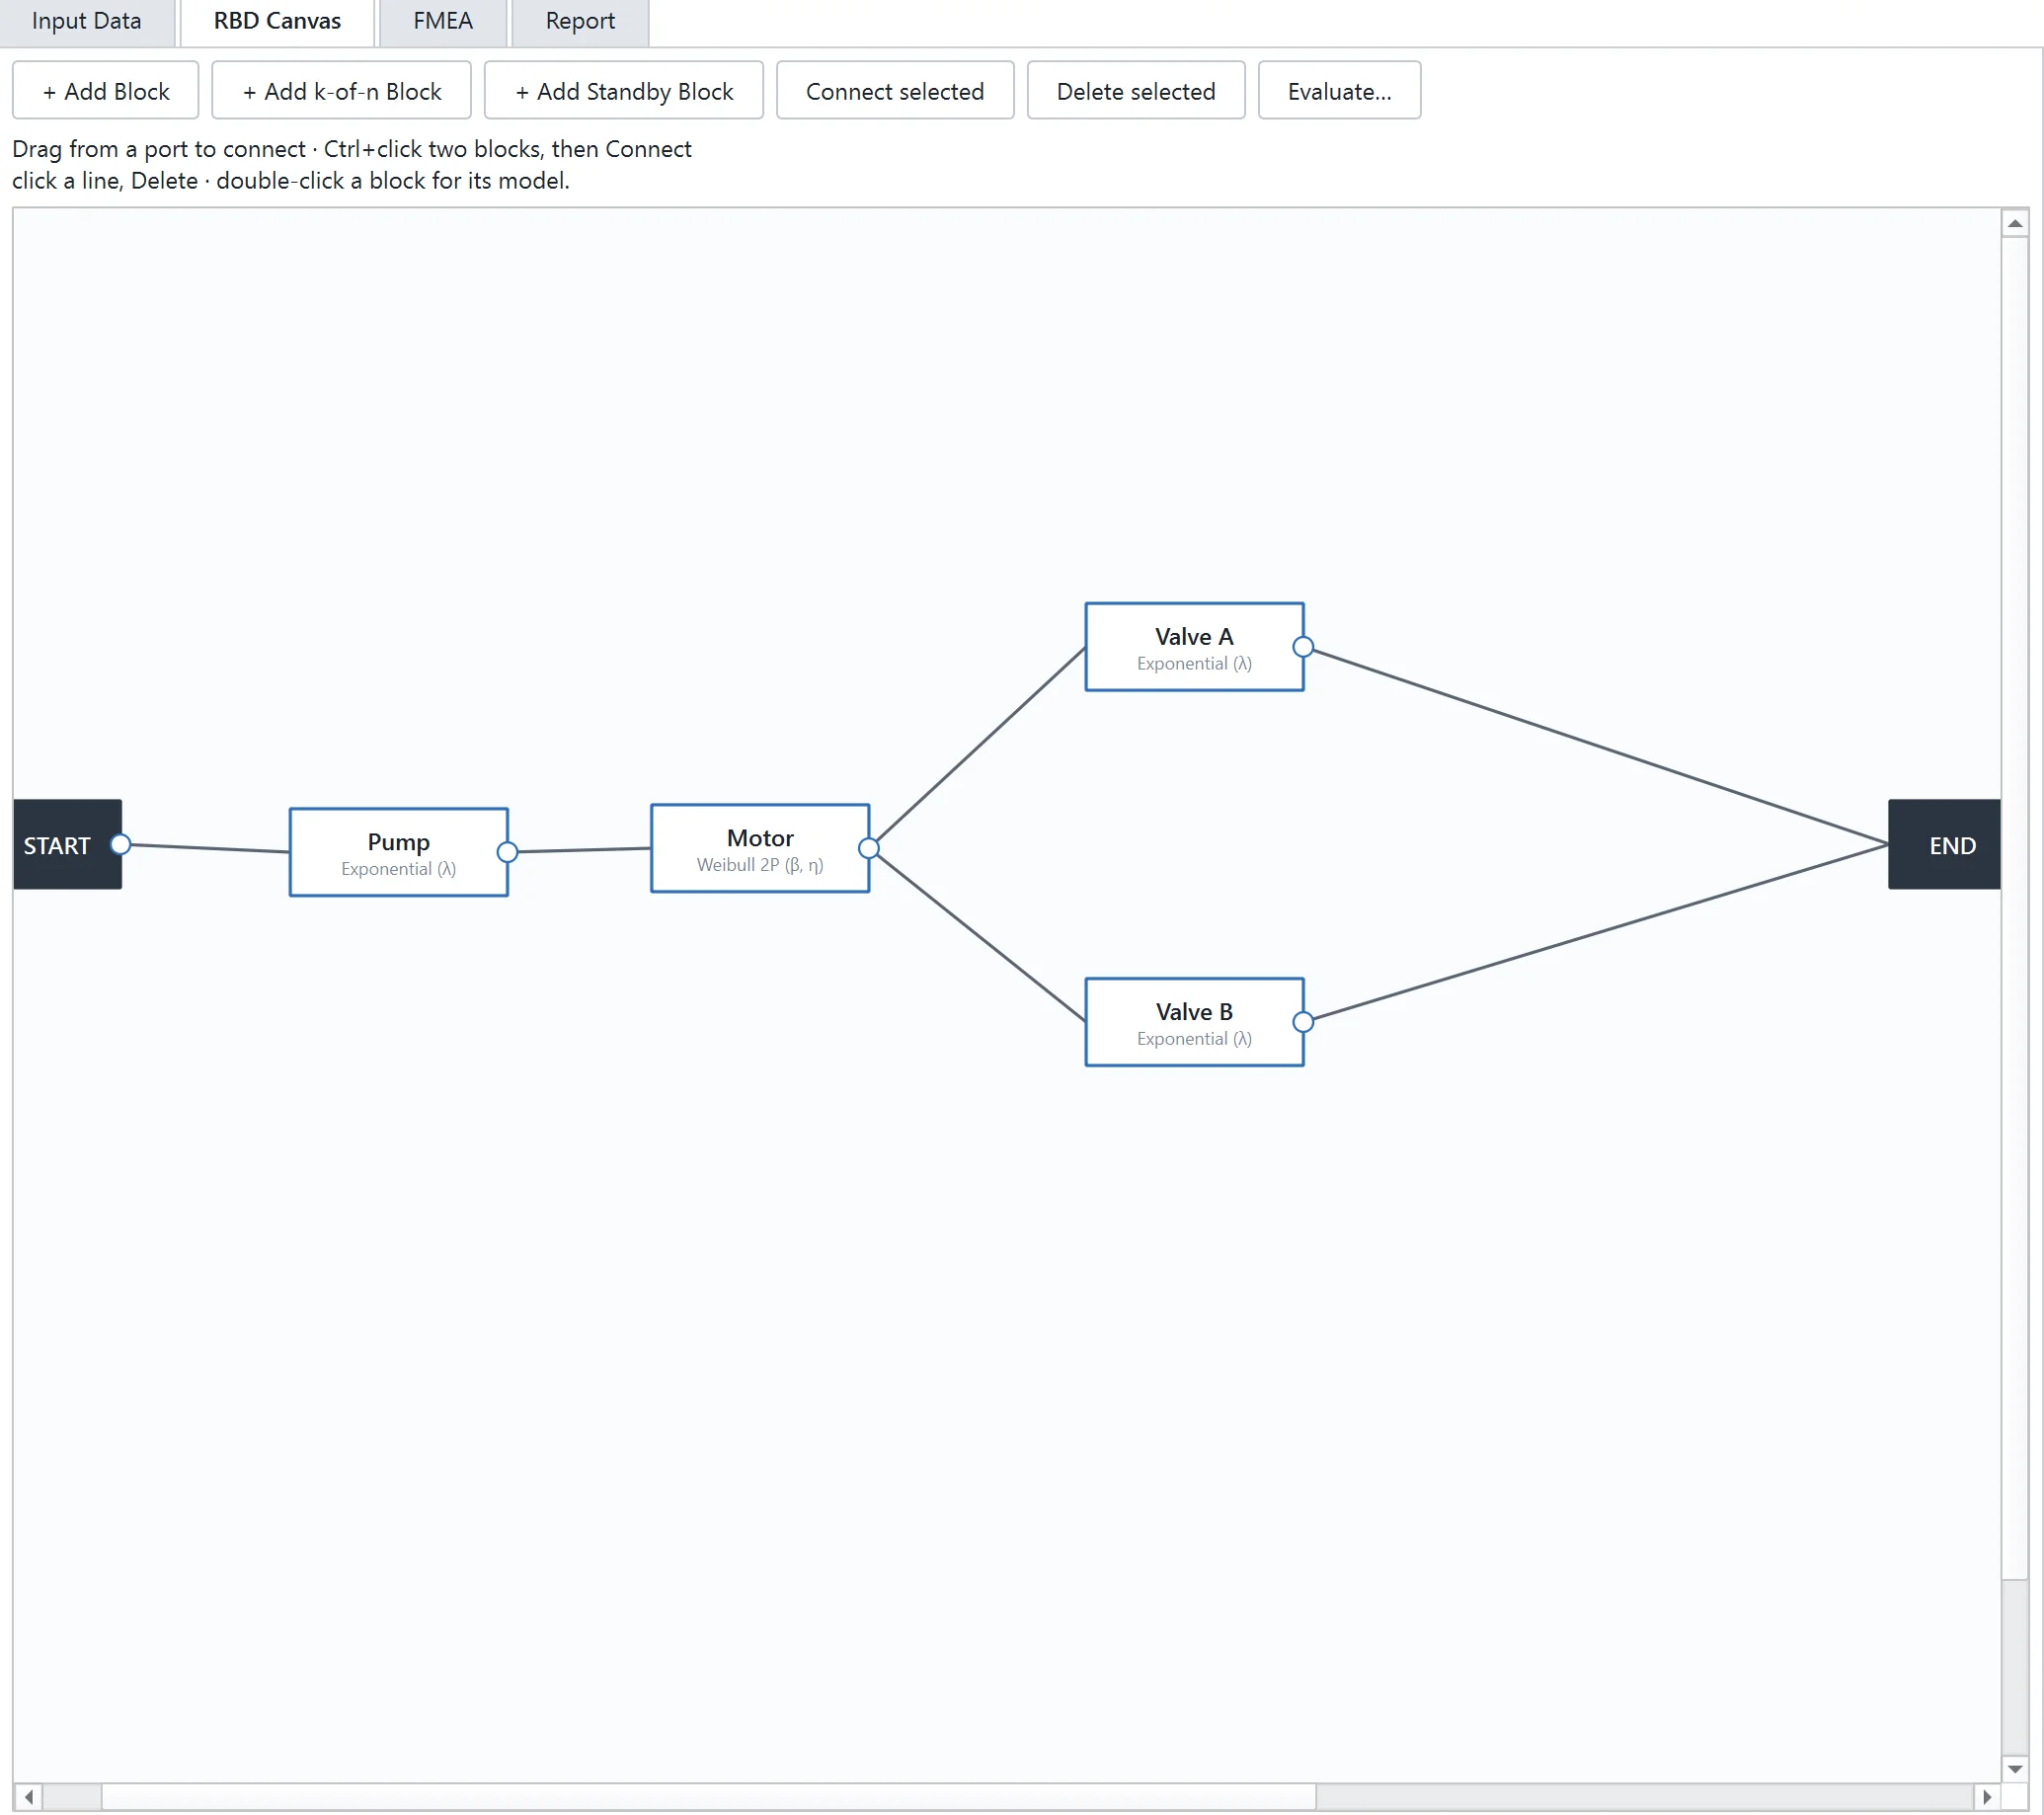
You draw the system with series, parallel, k-out-of-n and standby blocks. Each block takes its failure model from a distribution, a hazard model or one of your own analyses. ReliaEn evaluates the diagram at a mission time you choose. It reports the system reliability, the mean time between failures (MTBF) and the B10 life. The project file stores the diagram together with its results.
- RAM simulation and Markov analysis
Takes: the block diagram and the repair model. Gives: availability over time.
ReliaEn runs a Monte Carlo simulation of the block diagram. You set the random seed, so you can repeat a run and get the same result.
The Markov availability analysis handles wear-out, where failure rates increase with age. It offers four methods, and each method models a different kind of repair:
- Non-homogeneous Markov: minimal repair.
- Method of stages: renewal or partial restoration.
- Semi-Markov.
- Virtual-age simulation.
- Fault tree analysis (FTA)
Takes: the events and gates that lead to one top event. Gives: the cut sets, which show where the system is weakest.
You build a fault tree from gates and a top event. ReliaEn finds the cut sets of the top event. A cut set is a combination of events that together cause the top event.
- Optimisation and cost
Takes: the system reliability and the cost of each option. Gives: the lowest-cost choice of redundancy, spare parts and PM scope.
ReliaEn calculates the redundancy that gives the best system reliability. It also calculates the best stock of spare parts and the life-cycle cost of a system.
The preventive maintenance (PM) scope optimisation, PM-Scope, decides which severity classes preventive maintenance should control. Each control level prevents the breakdowns whose downtime is above a threshold. ReliaEn reports the control level with the lowest total cost.
- Failure mode and effects analysis (FMEA) studies
Takes: the failure modes of an asset, which you rate. Gives: a ranked risk list, which the RCM decision uses.
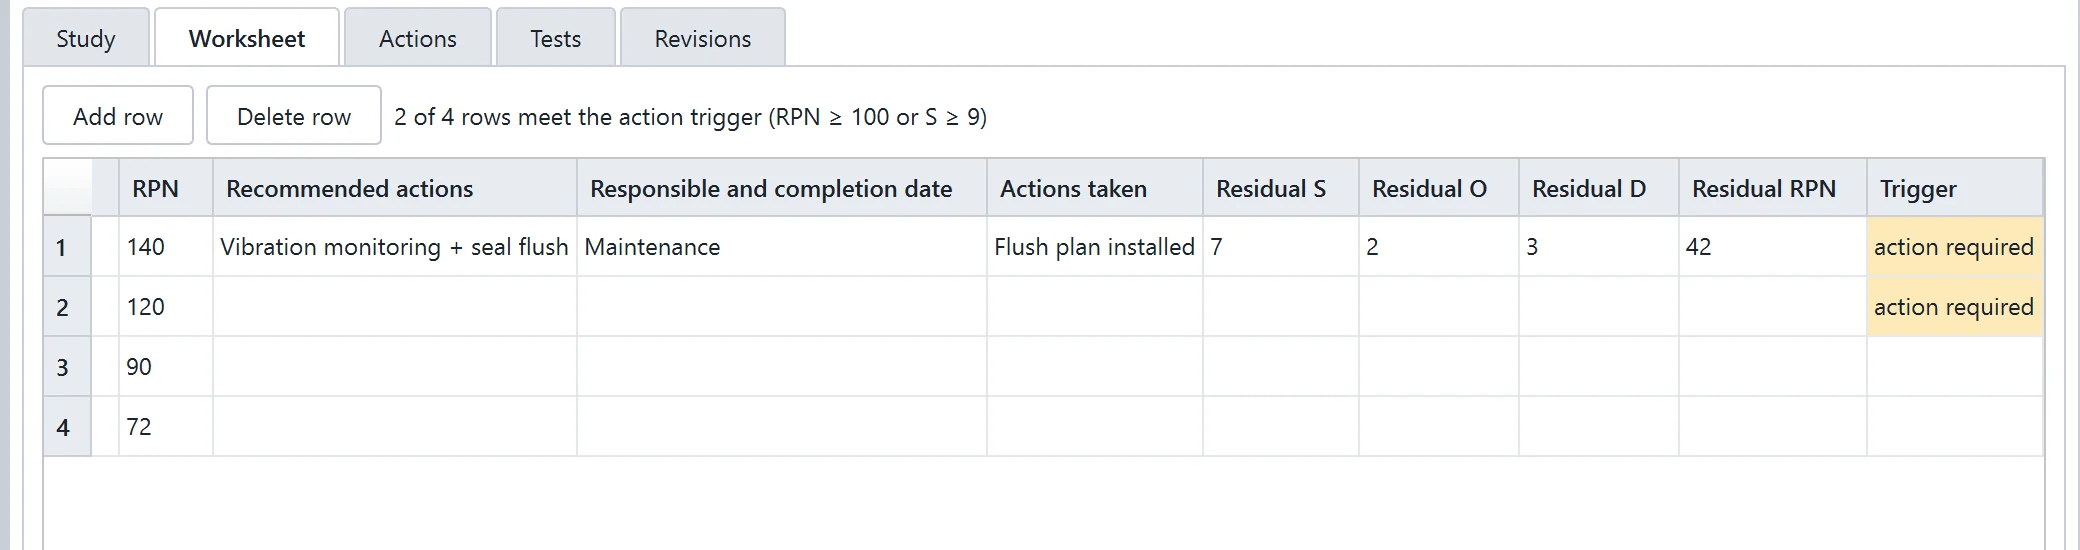
In the Process FMEA form, you rate severity, occurrence and detection on a scale of 1 to 10. ReliaEn calculates the risk priority number (RPN). After you record each action, it calculates the residual RPN. The matrix failure mode, effects and criticality analysis (FMECA) uses the same study.
ReliaEn keeps every revision of a study. You can import a study from an Excel workbook and export it back to Excel.
Each study belongs to an asset in the CMMS. ReliaEn flags every class-A asset that has no FMEA study.
- Reliability-centred maintenance (RCM): decision for each failure mode
Takes: the FMEA study and the Weibull model of the asset. Gives: one maintenance strategy for each failure mode, which becomes a PM plan in the CMMS.
For each failure mode in the FMEA study of an asset, the RCM logic tree selects a strategy. The tree uses the Weibull shape parameter of the asset, the severity and detection ratings of the failure mode, and the costs. The possible strategies are:
- On-condition maintenance
- Scheduled replacement
- Failure-finding
- Run to failure
- Redesign
These four screens follow the same line, from data to decision.
Computerised maintenance management system (CMMS)
Takes: the work you do on your assets. Gives: the records that the Reliability analyses read, and the place where their decisions are applied.
The CMMS stores your assets and work orders. The analyses use these records as their data, and the decisions flow back into the CMMS as PM plans, stock levels and work orders. The CMMS runs on one computer, or on a shared database server for a team.
- Assets
The asset register stores the asset hierarchy, specifications, meters, preventive maintenance (PM) plans and the work-order history of each asset. It also stores attachments and links each asset to its related records: its position in the hierarchy, its RBD block, its FMEA study, its work orders and failure events, and the parts in its bill of materials.
Each equipment asset has a Reliability tab. When the asset has at least 3 coded failures, ReliaEn fits a Weibull model to its coded corrective work orders. It fits the model again each time one of these work orders is closed. The tab also shows the MTBF and the mean time to repair (MTTR) from the history of the asset.
- Work orders
A work order moves from draft to closed. It records labour, parts, external costs and a status log. ReliaEn sets the priority of each work order from the class of the asset. When you close a corrective work order, it becomes a failure record for the analyses.
If two people edit the same record, ReliaEn rejects the later save and changes nothing. It shows a one-sentence message that explains what happened and what to do next.
- Preventive maintenance and spare parts
PM plans can be time-based or condition-based. Spare parts follow a minimum / maximum reorder policy.
ReliaEn calculates the replacement age with the lowest cost per hour and shows it next to the PM interval that you set. For each spare part, it calculates the reorder point and the maximum stock needed for your service level over the lead time. It shows these values next to your own minimum and maximum, together with the probability of a stock-out.
Your PM intervals and stock levels do not change until you click to apply a result.
- Failure reporting, analysis and corrective action system (FRACAS)
Each work order carries failure codes. ReliaEn links each failure event to its asset, its FMEA study and its corrective work order. A recommendations inbox holds the actions that follow from a failure.
- Key performance indicator (KPI) page
The KPI page reads all assets under the asset that you select and shows the result of the actions above. Each KPI can have a target and a caution level. The status of each KPI is OK, CAUTION or ALERT. One click adds the KPI page to a report.
- Meters, job plans and service requests
- Meters: When a meter reading passes its limit, ReliaEn creates a condition-based work order.
- Job plans: A job plan holds tasks, parts and labour. Each work order that you create from it receives them.
- Service requests: When you approve a service request from the technician app, it becomes a work order.
- Mobile work execution
The technician app runs on a phone. It shows the technician the assigned work orders, the PMs that are due and the inspection checklists. The technician records findings with photos and meter readings, and closes the job at the asset. Photos and readings taken offline are sent to the CMMS at the next sync. These closed jobs are the new records for the next analysis.
- Asset criticality
Takes: the three ratings of each asset. Gives: a class A, B or C, which sets priorities and feeds Asset Health.
ReliaEn scores each asset on three factors: consequence, likelihood and detection (C × L × D). From the result it places the asset in class A, B or C on a criticality matrix. Each assessment is saved as a versioned record. The class sets the priority of the asset and the priority that ReliaEn calculates for its work orders.
- Asset Health
Takes: the CMMS records and the criticality class. Gives: a risk ranking and draft work orders.
ReliaEn calculates three scores for each equipment asset:
- Health score (0 to 100). It combines 5 factors that the CMMS already holds: open work orders, corrective work orders in the last 12 months, age compared with the asset’s mean time to failure, the remaining-useful-life ratio, and availability in the last 12 months.
- Criticality score.
- Risk = (100 − Health) × Criticality / 100.
The Asset Health page shows a Criticality × Health matrix, a Criticality × Risk matrix, and a list of assets ranked by risk. For each high-risk asset that has no open predictive work order, ReliaEn drafts one. You review each draft, and an approved draft is a new work order.
- Bridge
Takes: export files from your enterprise maintenance system. Gives: CMMS records, which start the same line at the first step.
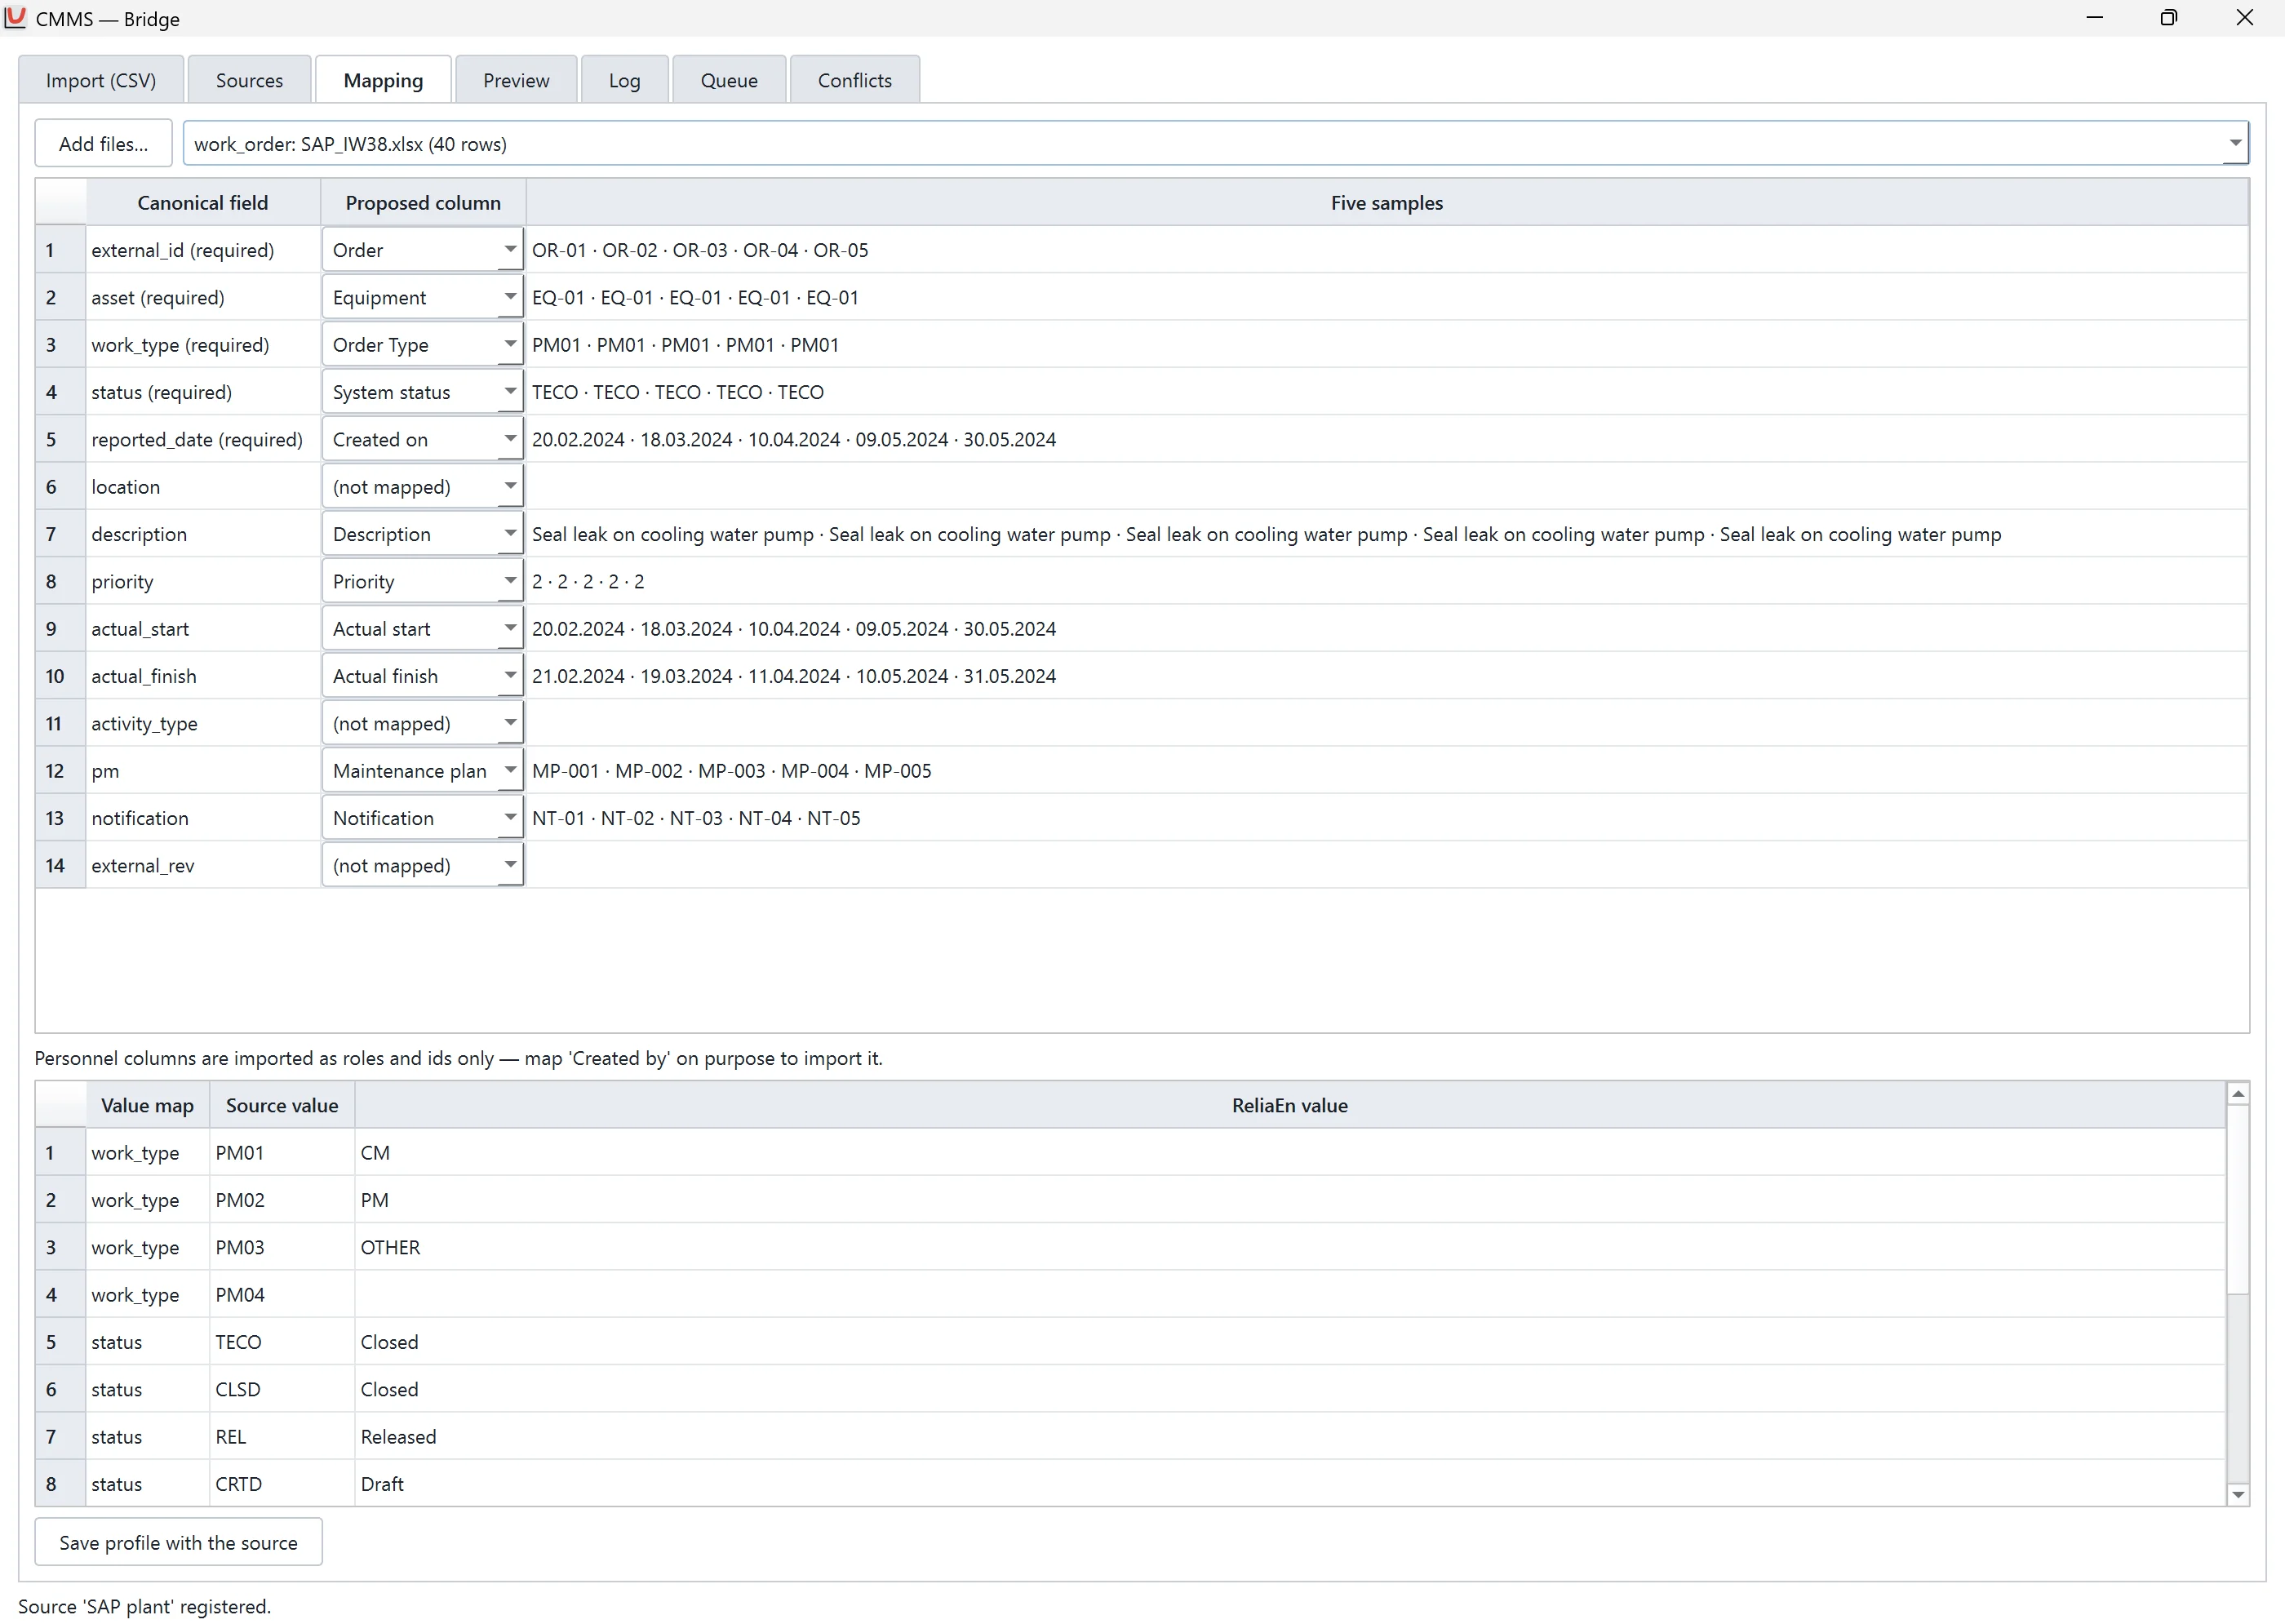
The Bridge imports export files from SAP PM/EAM and IBM Maximo. The Import Wizard loads assets, work orders, PMs, meters, items and failure codes into the ReliaEn CMMS.
Your enterprise maintenance system remains the system of record. ReliaEn reads only the files that you export. It does not connect to that system.
These five screens follow the same line, from records to action.
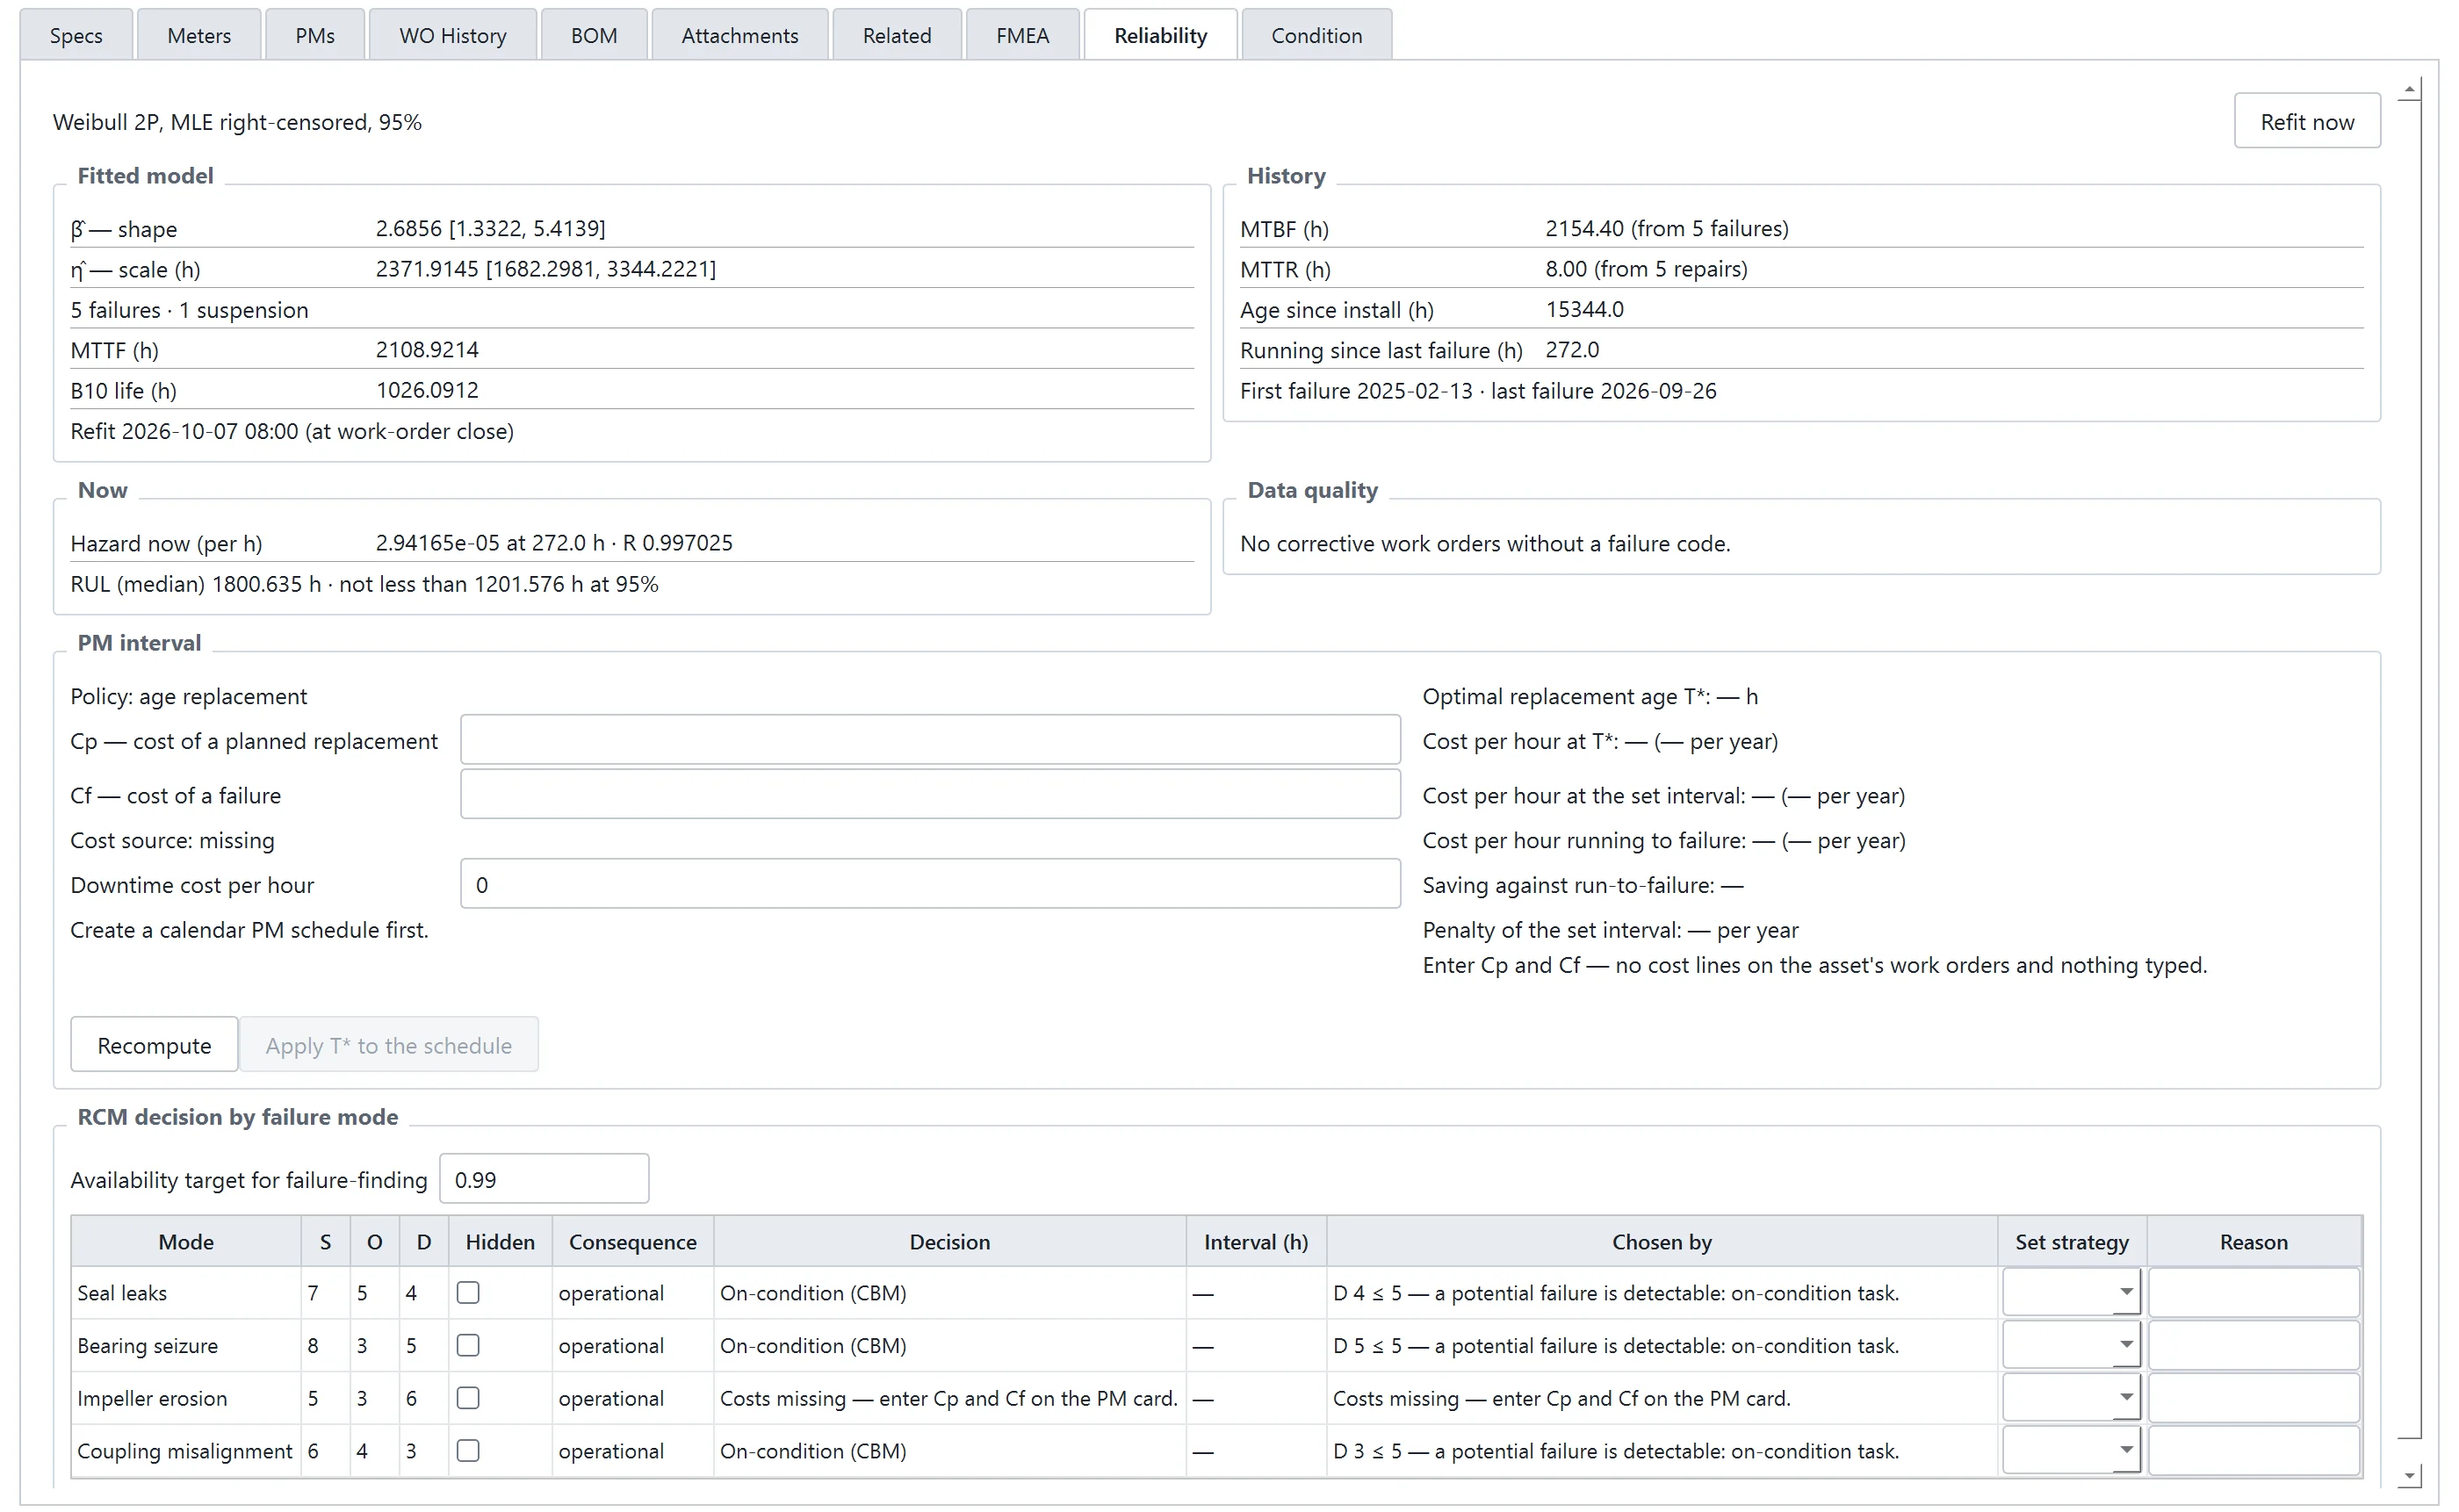
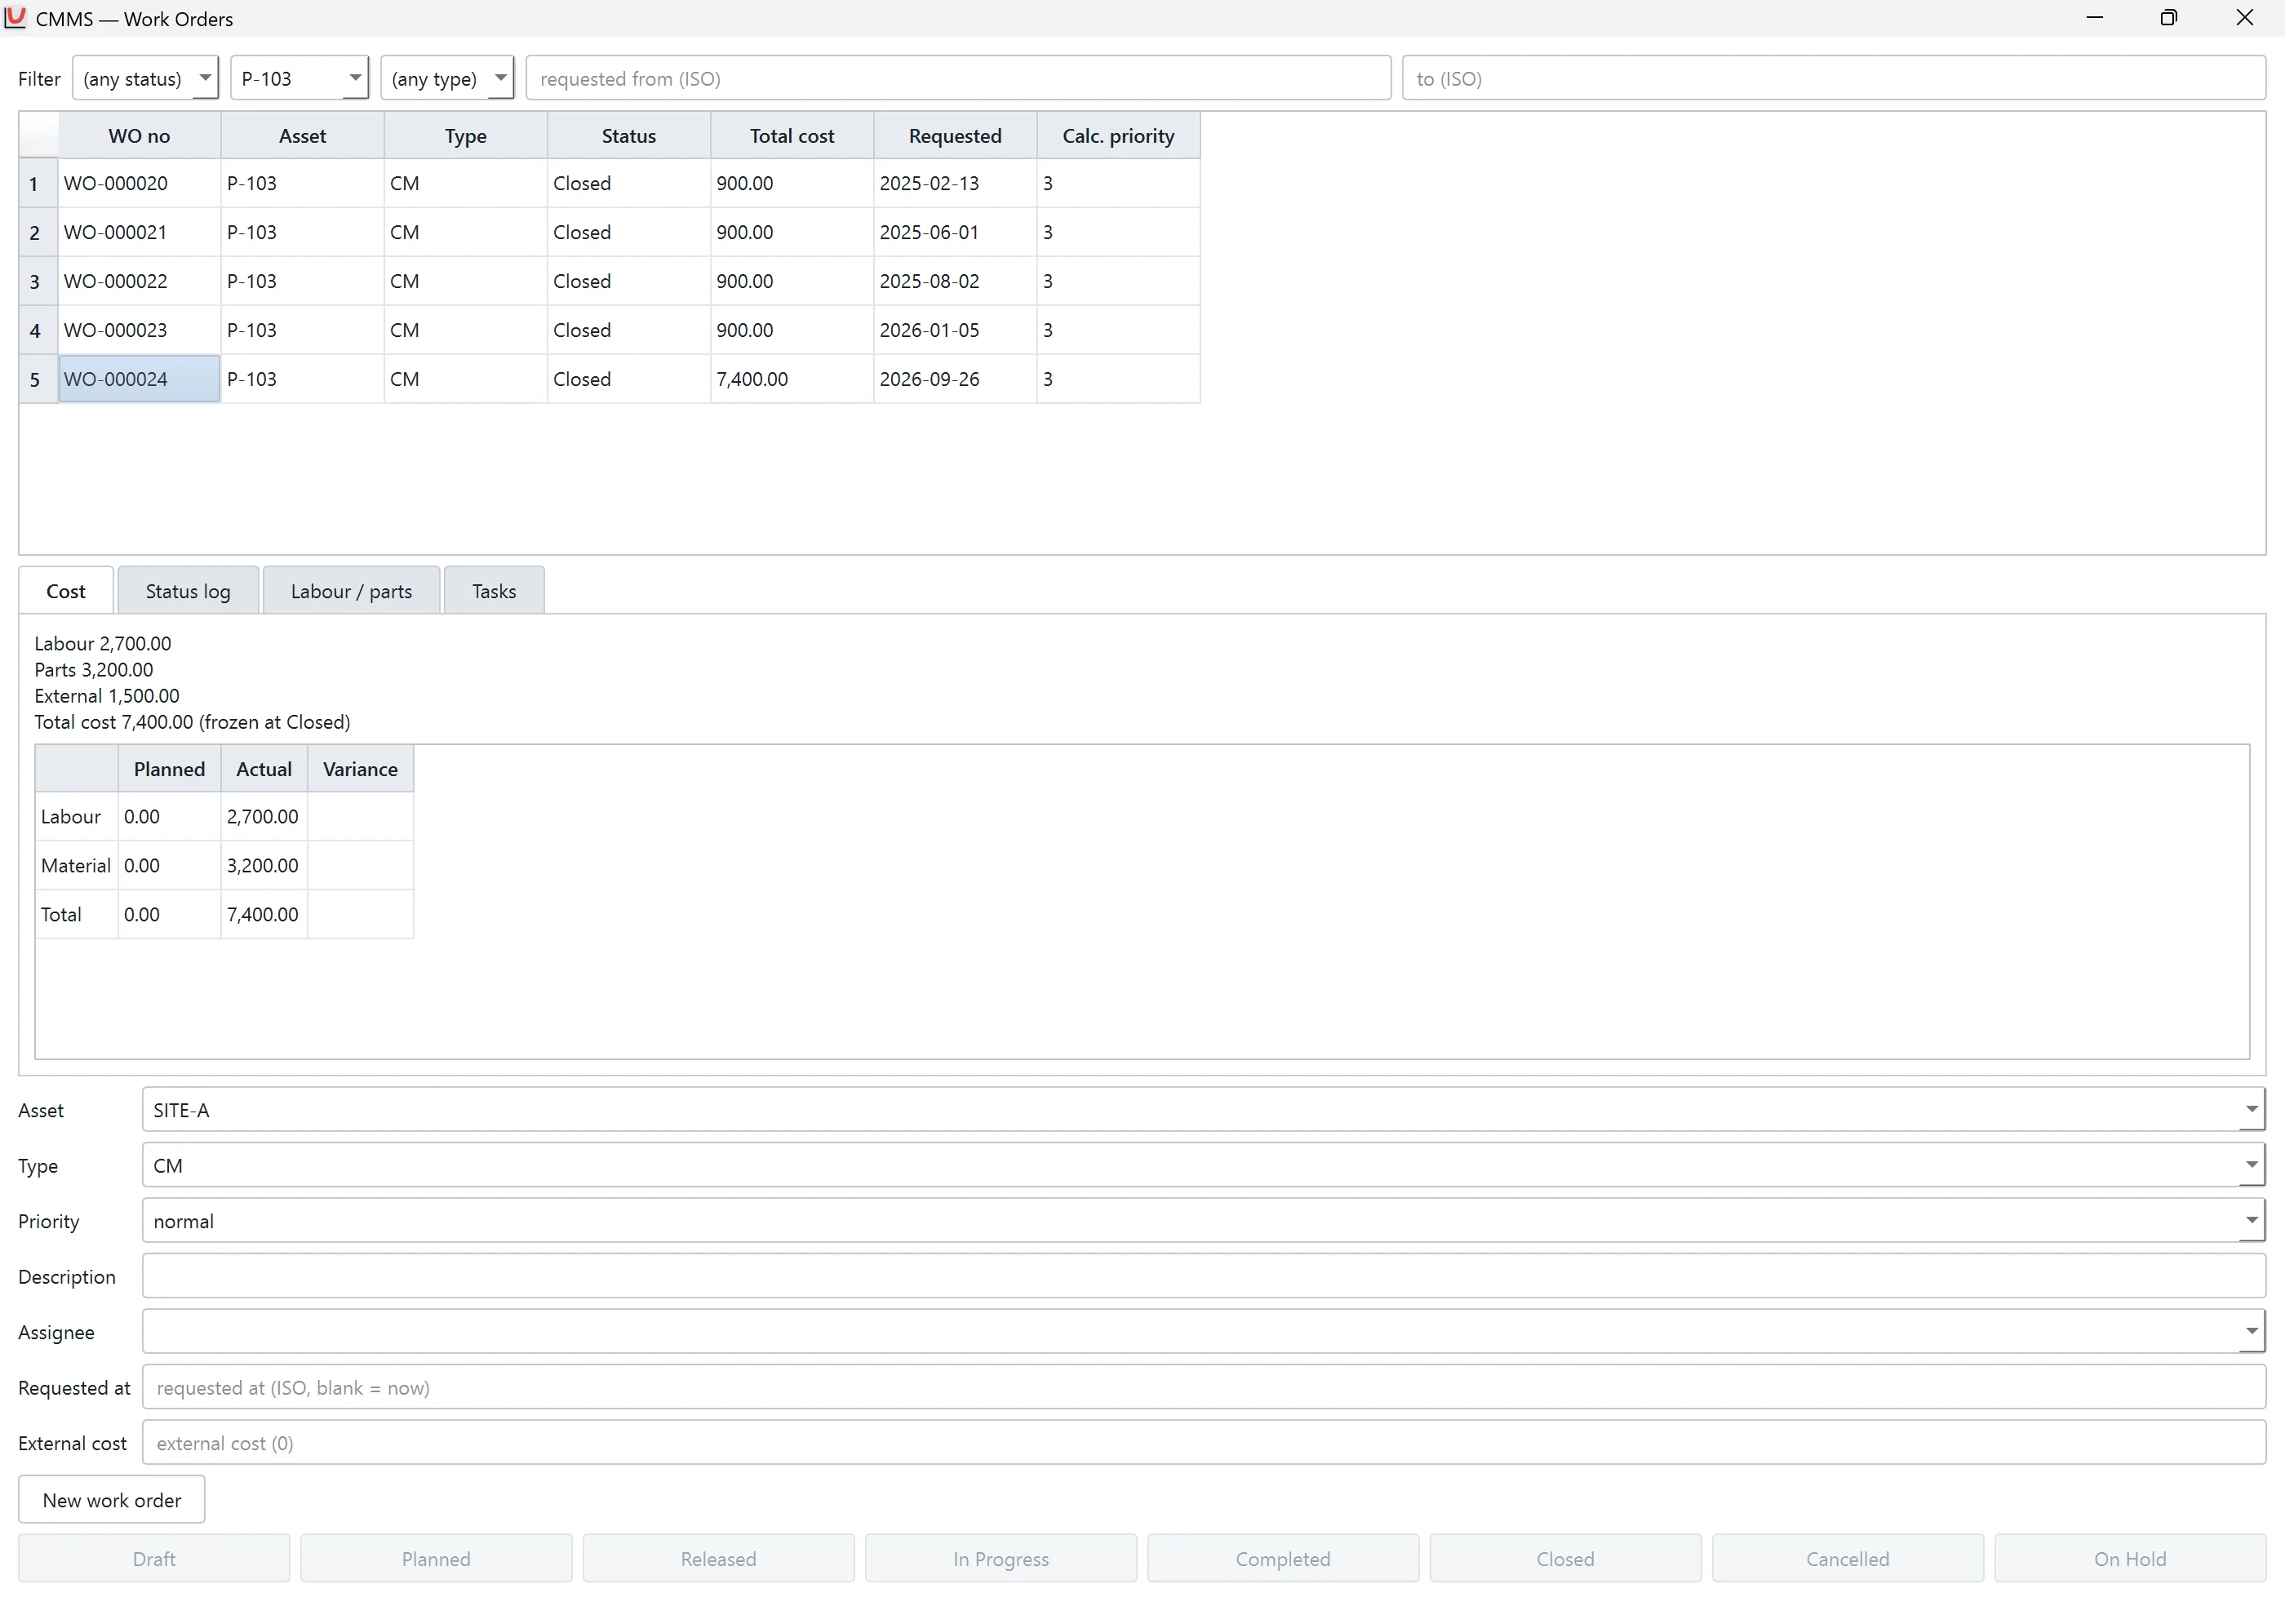
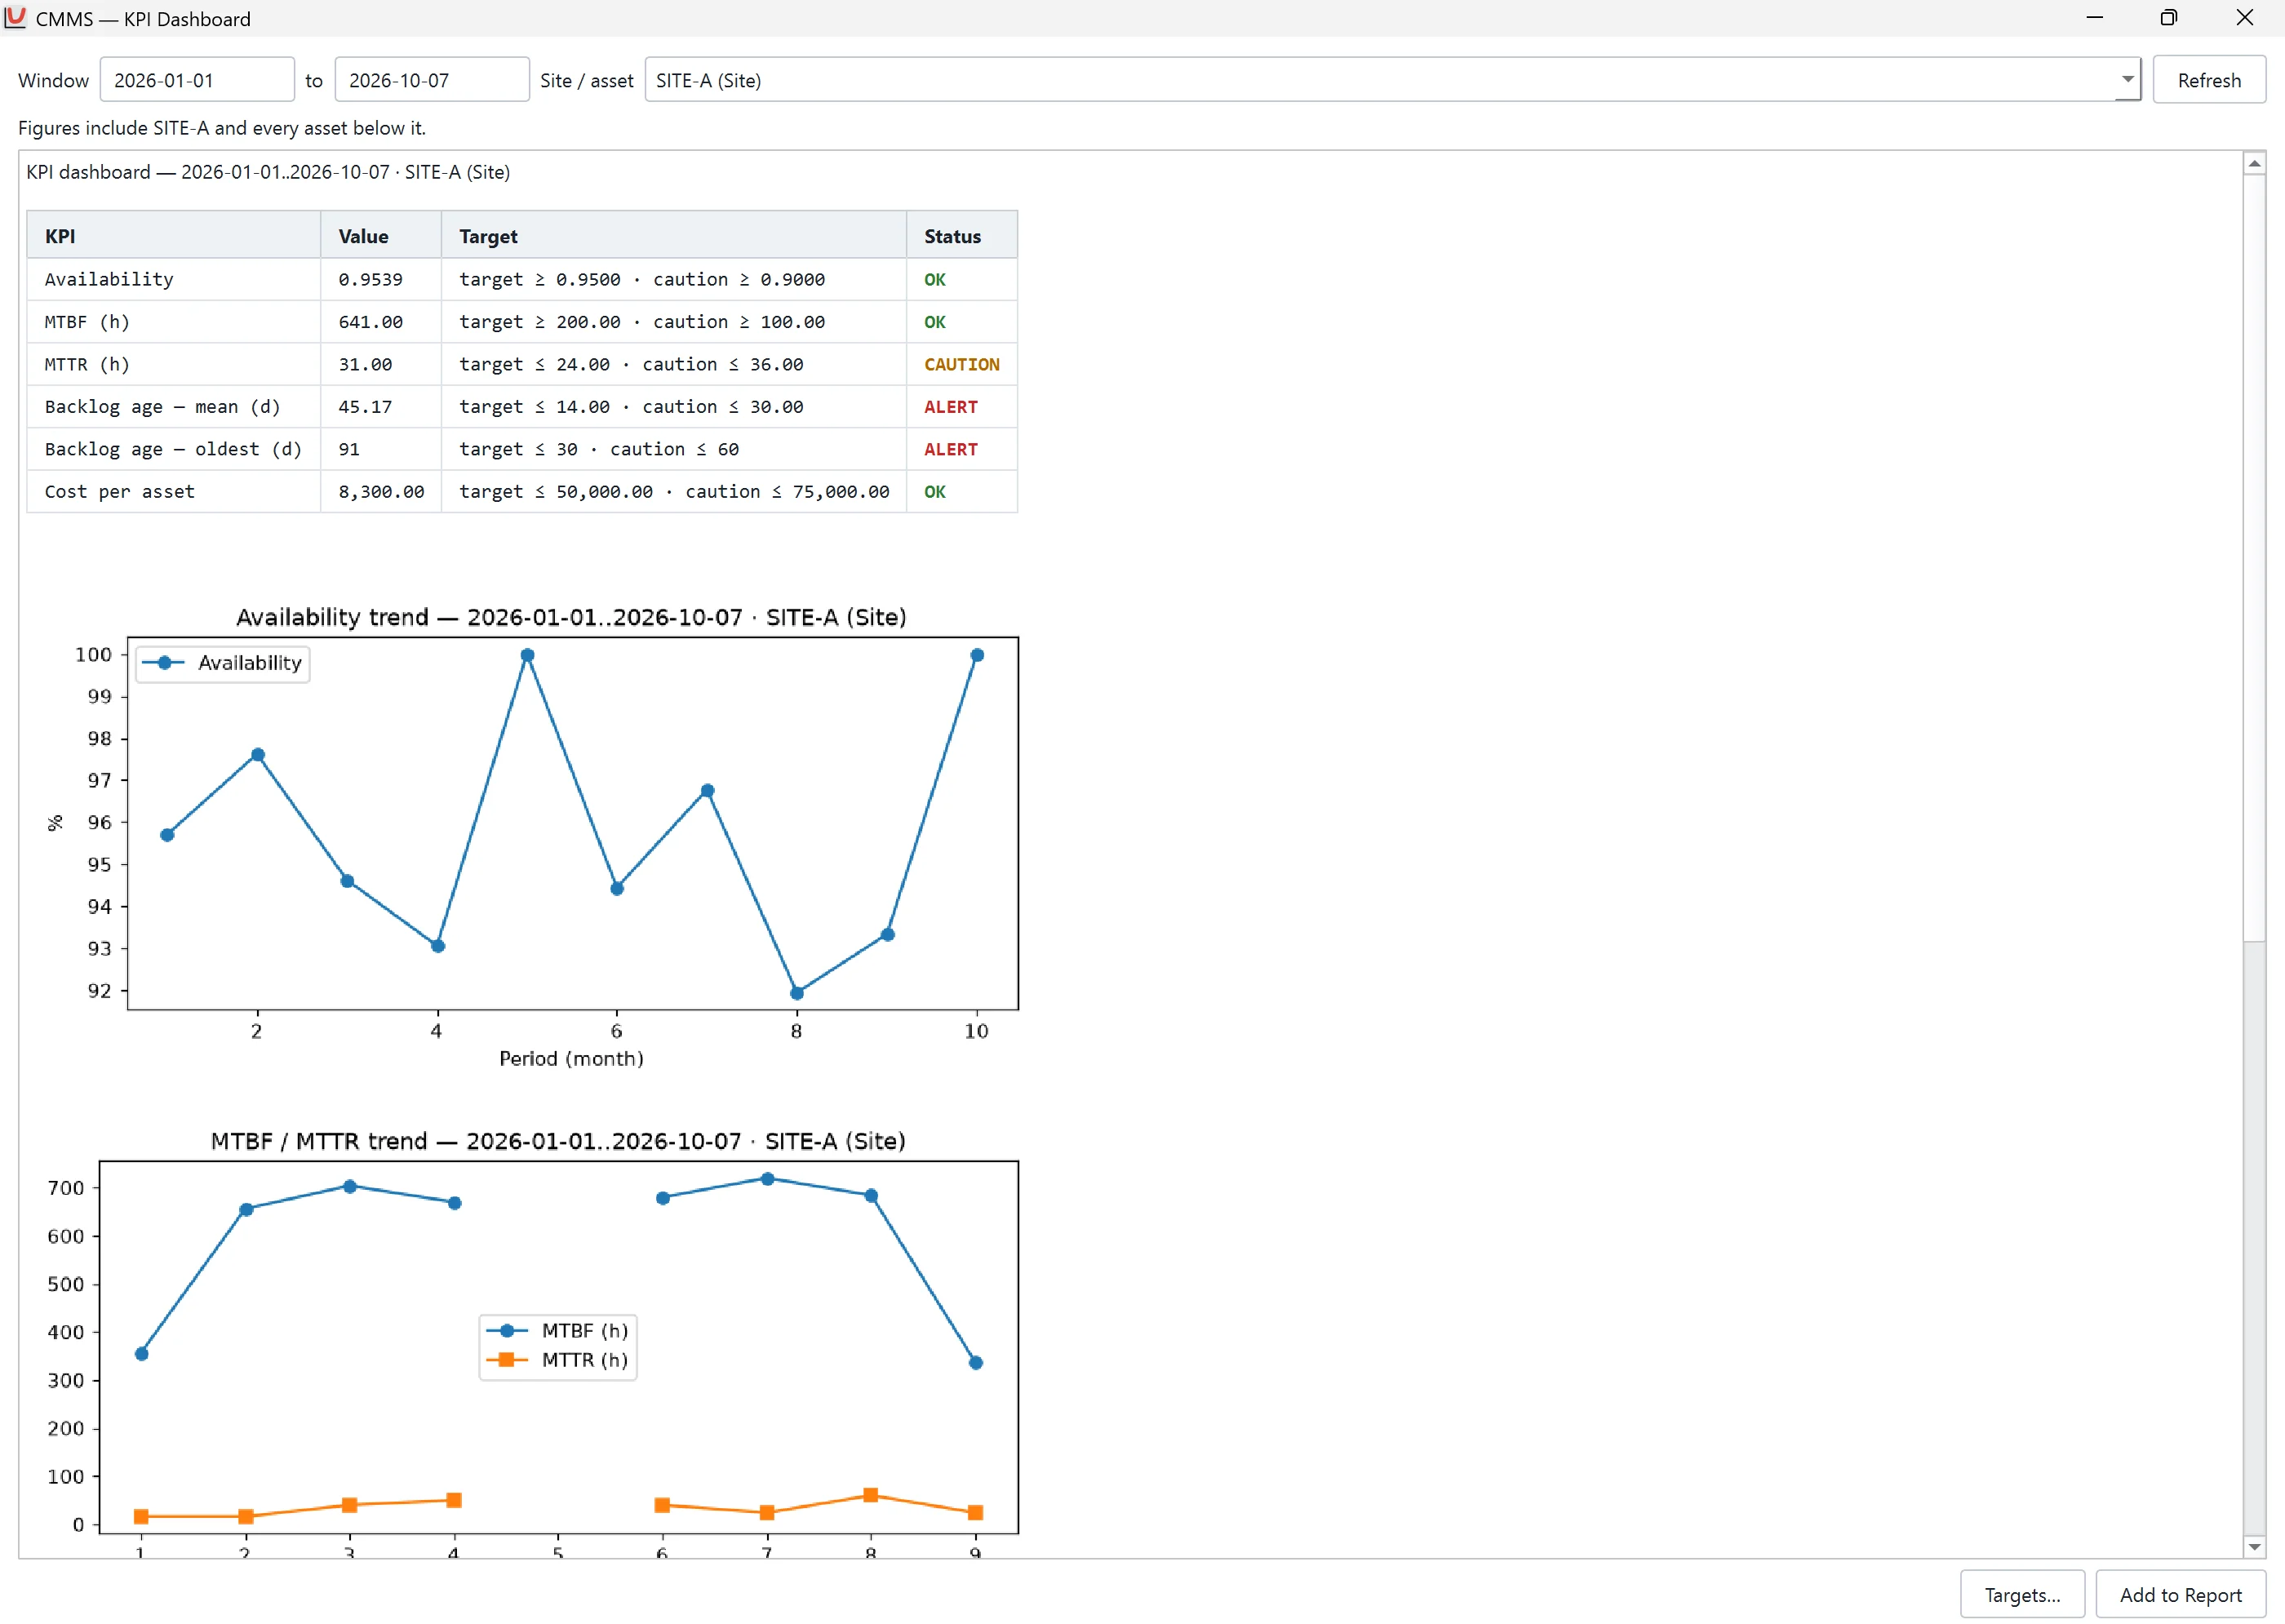
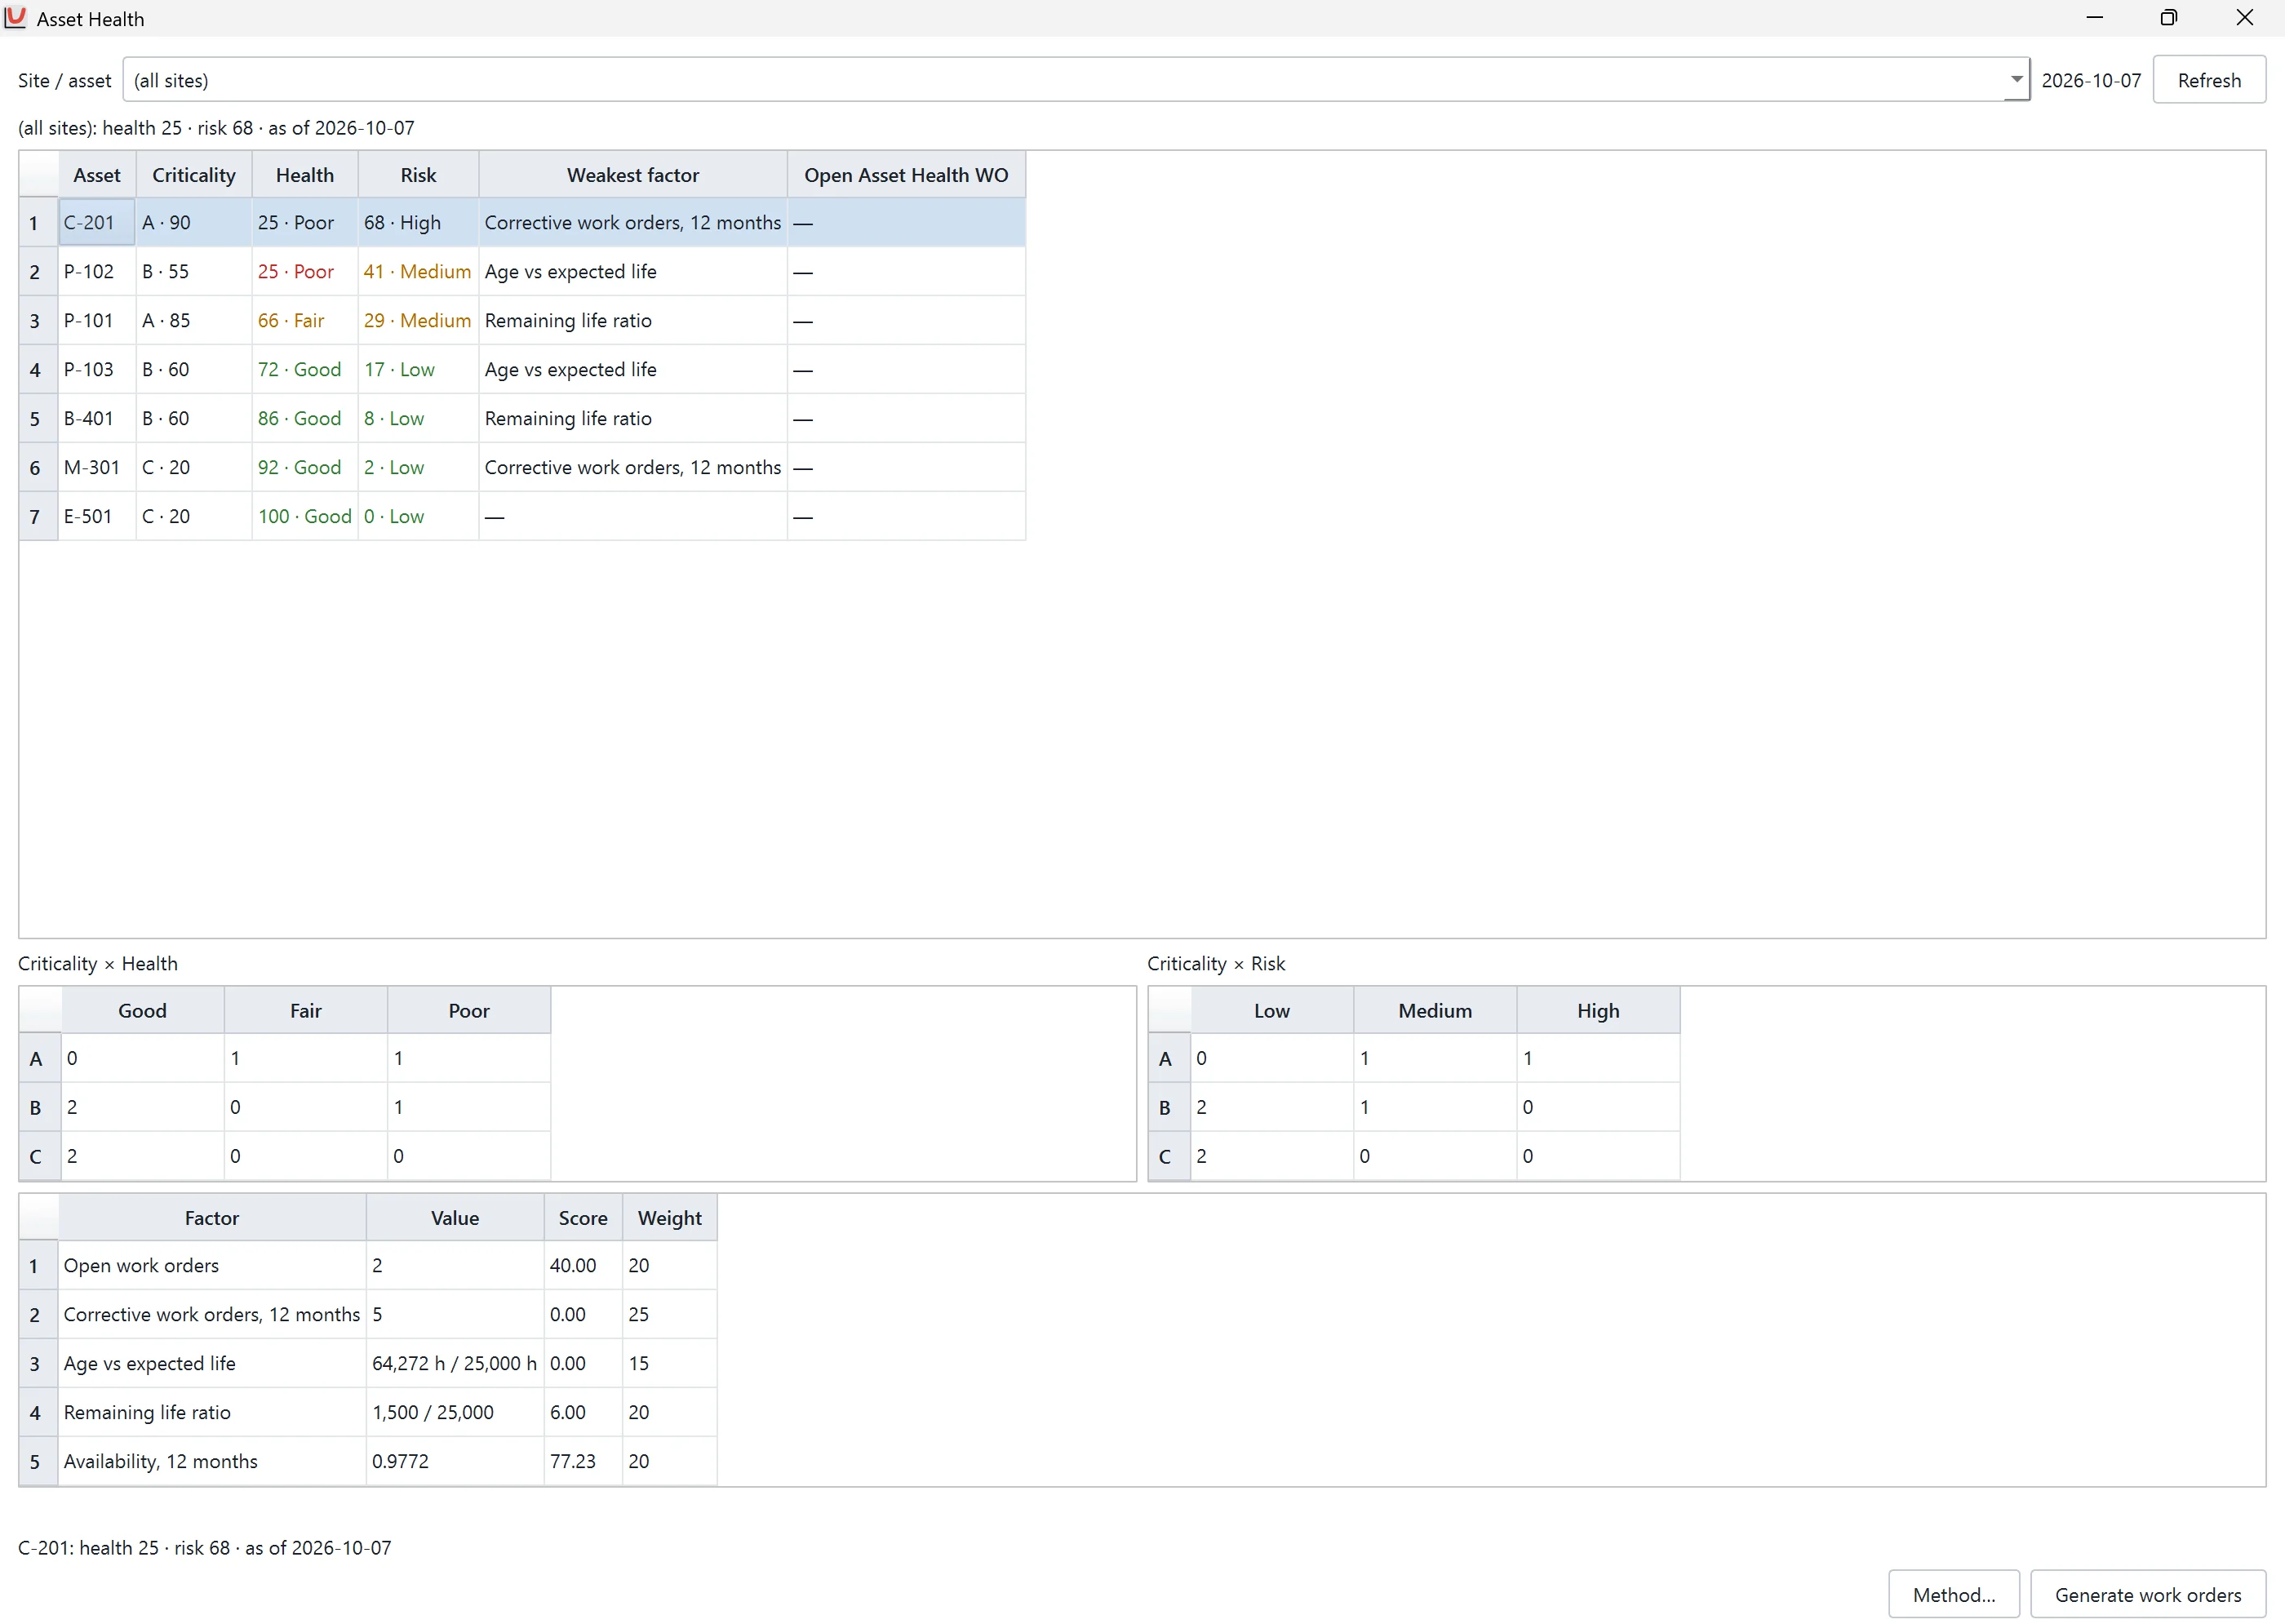
Product names are the property of their owners. No affiliation is implied.
AI Support
Takes: a request in Thai or English. Gives: the same standard ReliaEn report that you would build yourself, so it joins the same line.
- How AI Support works
- You drop a data file on the AI Support panel, or you name an asset. You write what you need in Thai or English.
- The Column mapping card shows how ReliaEn reads the columns of your file. You confirm the mapping.
- The Plan card shows the analysis that ReliaEn will run. You confirm the plan.
- ReliaEn runs the analysis and produces a standard ReliaEn report.
AI Support has seven tools, and each one reads or analyses. They profile a file, import a table and fit a Weibull model. They calculate a life quantity, such as the B10 life or the MTTF. They also read a report, find an asset and read the work orders of that asset.
The Answer card gives a written narrative. Each number in it is a chip from a cell of the report. A click on a chip opens the report at that cell.
Menu mode: when no model is connected, or the computer cannot run one, you choose the analysis from a menu. You attach the file, and ReliaEn produces the same standard report.
In 1.0.0, AI Support reads and analyses your data. It does not change your data.
ReliaEn 1.0.1 (November) adds write tools that act on your approval, RBD and FTA tools, the jobs view and replay.
- Model selection
By default, AI Support uses a language model that runs on your own computer. You can instead choose a cloud provider from the list in ReliaEn and enter your own application programming interface (API) key. Windows stores the key in its credential store.
- Privacy
With the local model, your data stays on your computer. AI Support sends data to a cloud provider only if you choose that provider and enter your own key. Before the first cloud request, ReliaEn asks for your approval. Each job records which provider it used.
- Computer requirements
The local model needs at least 16 GB of memory. Without a graphics card, it runs slowly. On a computer with less memory, use a cloud provider.
Thai and English, on your own computer
Everything above runs in one application, from one licence, in Thai or English, on your own computer. Engineers and technicians use the same screens and the same reports.
- Thai and English
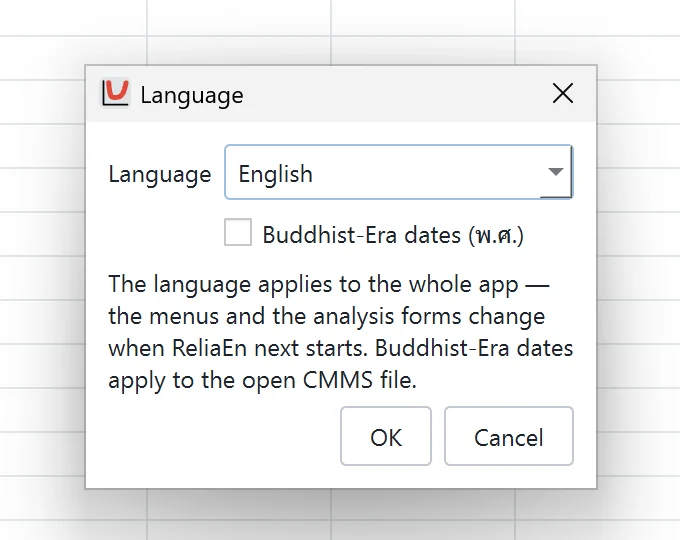
One setting switches the whole application between Thai and English. The Thai text follows one reviewed glossary of Thai reliability terms. The report guides under Help are in English in version 1.0.0 and in Thai from version 1.0.1.
- Data import and export
Data enters and leaves at the two ends of the line:
- Import: Excel, CSV and JSON worksheets, and data from an SQL database.
- Export reports: PDF, HTML or Word.
- Export plots: PNG, SVG, PDF or EPS.
- Export work orders: CSV.
- Licence and updates
Each computer has a signed licence file that works offline. Signed updates install from inside the application, and ReliaEn first backs up your CMMS file. The update check sends no information about you.
- Windows
ReliaEn runs on 64-bit Windows 10 (version 1809 or later) and Windows 11.
Try the whole line on your own records. The free trial runs for 30 days on one computer with every module enabled.